(udacity Nural networks에 있는 코드)
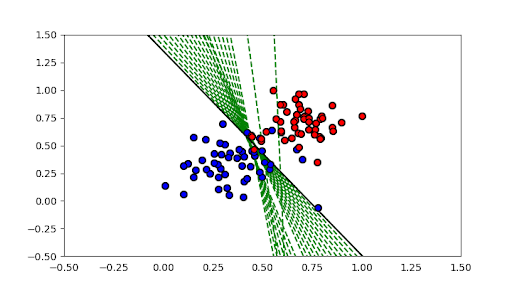
2차원에 여러점과 Label이 1과 0으로 주어졌을 경우
random 형태의 weight 와 Bias를 선택하고 해당 선에서 Label 1과 0을 분리하는 코드
기억해야 할 것은
- 선을 위로 올릴때는 weight와 Bias를 빼야한다
- 선을 아래로 내릴때는 weight와 Bias를 더해야한다.
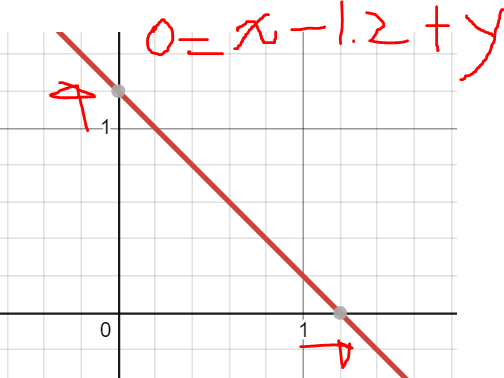
이것을 그림으로 보자.

$$ 0 = x - 1 + y $$
의 그래프이다 x 축을 기준으로 오른쪽으로 라인을 옮기기 위해서는 x의 weight를 낮추면 된다.

x의 weight를 0.2 빼면 그래프 선이 위로 올라가는 것을 알 수 있다.
마찬가지로 bias를 낮출경우 y의 좌표와 x의 좌표가 올라가는 것을 확인 가능하다.

import numpy as np
import csv
# Setting the random seed, feel free to change it and see different solutions.
np.random.seed(42)

def stepFunction(t):
    if t >= 0:
        return 1
    return 0

def prediction(X, W, b):
    return stepFunction((np.matmul(X,W)+b)[0])

# TODO: Fill in the code below to implement the perceptron trick.
# The function should receive as inputs the data X, the labels y,
# the weights W (as an array), and the bias b,
# update the weights and bias W, b, according to the perceptron algorithm,
# and return W and b.
def perceptronStep(X, y, W, b, learn_rate = 0.01):
    # Fill in code
    for i in range(len(X)):
        yHat = prediction(X[i],W,b)
        #[target 1, yhat 0] x,y,bias 전체에 더해줘서 선을 내려오게 한다
        if y[i] - yHat == 1:
            W[0] += X[i][0] * learn_rate
            W[1] += X[i][1] * learn_rate
            b += learn_rate
        #[target 0, yhat 1] x,y,bias 전체에 빼줘서 선을 올라오게 한다
        elif y[i] - yHat == -1:
            W[0] -= X[i][0] * learn_rate
            W[1] -= X[i][1] * learn_rate
            b -= learn_rate
    return W, b

# This function runs the perceptron algorithm repeatedly on the dataset,
# and returns a few of the boundary lines obtained in the iterations,
# for plotting purposes.
# Feel free to play with the learning rate and the num_epochs,
# and see your results plotted below.
def trainPerceptronAlgorithm(X, y, learn_rate = 0.01, num_epochs = 25):
    x_min, x_max = min(X.T[0]), max(X.T[0])
    y_min, y_max = min(X.T[1]), max(X.T[1])
    W = np.array(np.random.rand(2,1))
    b = np.random.rand(1)[0] + x_max
    print(W, b)
    # These are the solution lines that get plotted below.
    boundary_lines = []
    for i in range(num_epochs):
        # In each epoch, we apply the perceptron step.
        W, b = perceptronStep(X, y, W, b, learn_rate)
        boundary_lines.append((-W[0]/W[1], -b/W[1]))
    return boundary_lines

X = []
Label = []
with open('data.csv') as csv_file:
    csv_reader = csv.reader(csv_file,delimiter=',')
    for row in csv_reader:
        X.append([float(row[0]),float(row[1])])
        Label.append(float(row[2]))

x = np.array(X)
y = np.array(Label)

trainPerceptronAlgorithm(x,y)
728x90
반응형
'AI' 카테고리의 다른 글
| Softmax function (0) | 2021.07.17 |
|---|---|
| Sigmoid Function (0) | 2021.07.17 |
| Object Orient Programing (0) | 2021.07.04 |
| Software Engineering 소개 (0) | 2021.07.03 |
| AWS DeepLens 소개 (0) | 2021.07.03 |
